# Concluding thoughts
# Human bias in data
- Humans are present at every stage of the data and mapping process: humans observe the world and structure the observations into data; humans interpret this data and visualize it into maps.
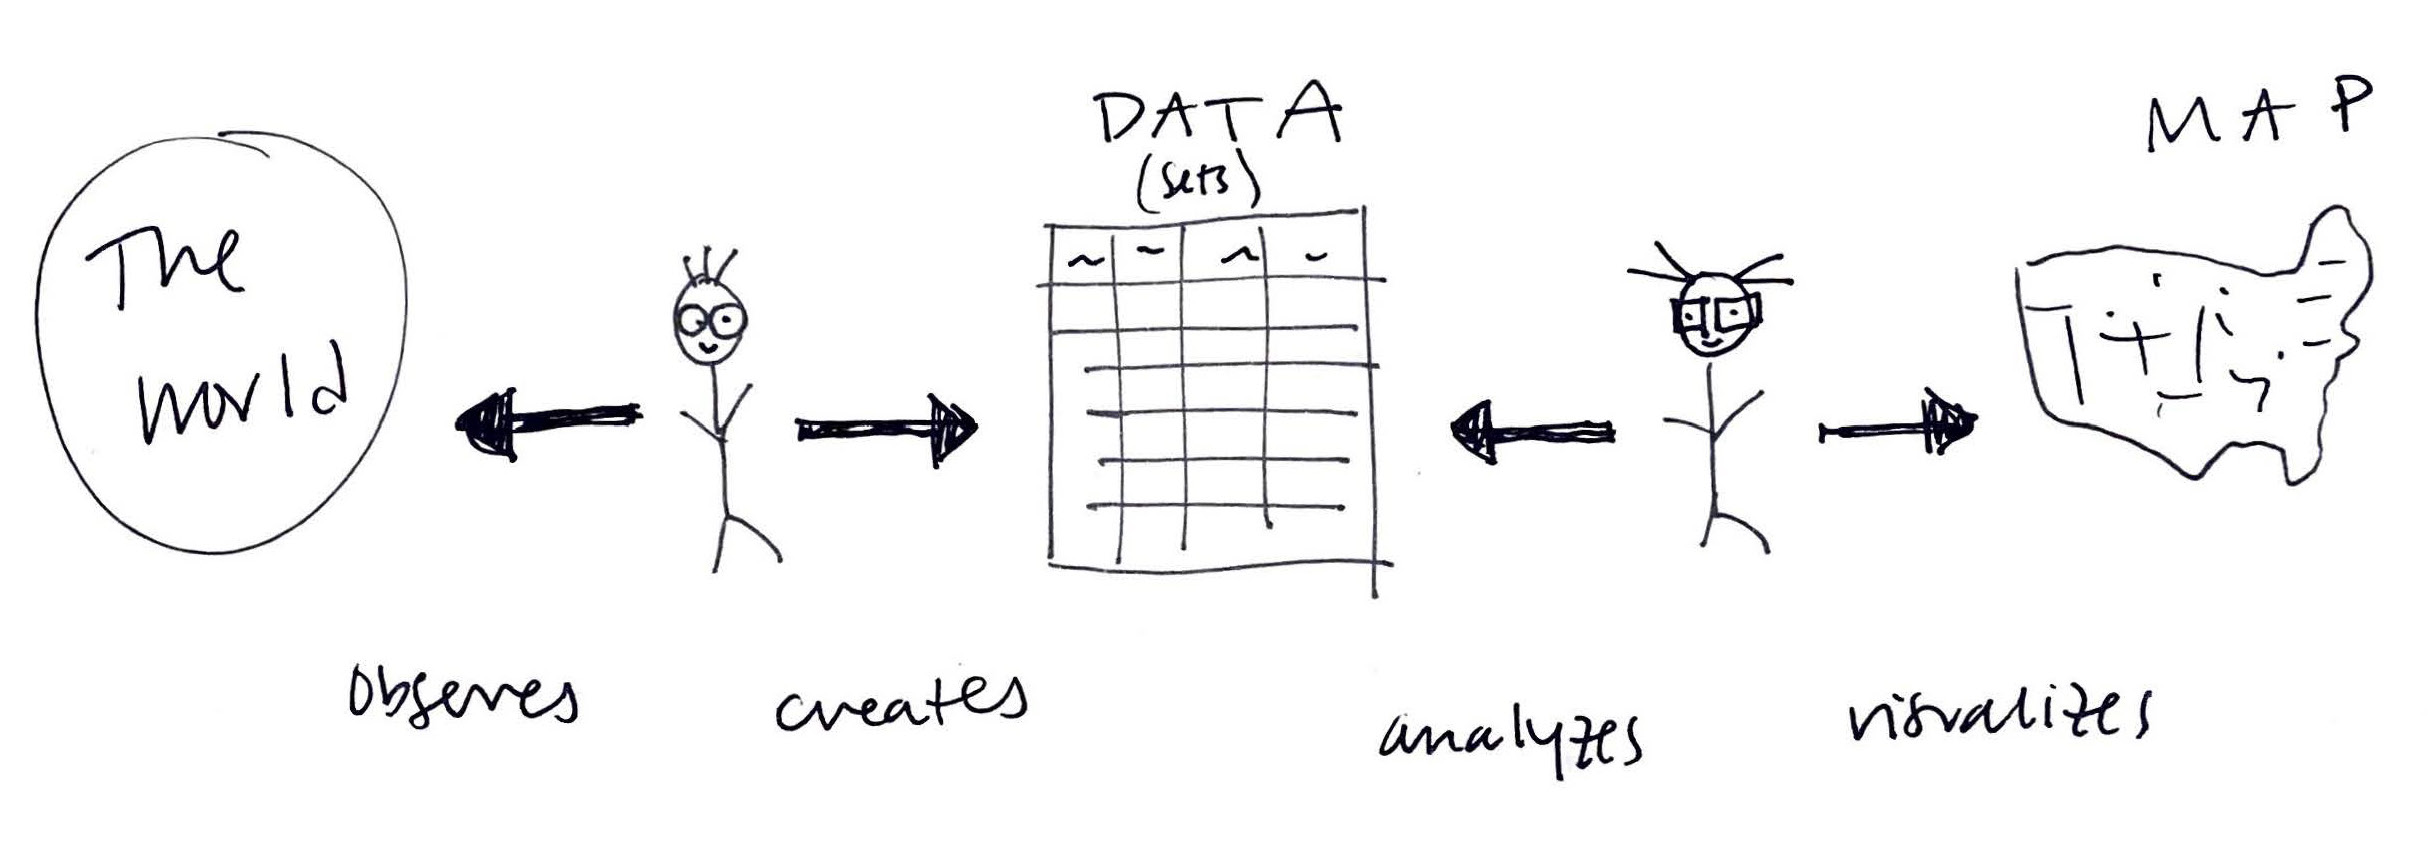
An illustration showing the human role in the data and mapping process, Tess McCann (2021).
- Because there are humans at every step of the way, human biases can seep into data and into maps (recall the two Wi-Fi accessibility maps from Session 1!)
Humans bias and distortion actually begins much earlier than that—with the collection and structuring of data.
- What gets lost in translation between spreadsheet and map?
- Some helpful vocabulary for identifying this distortion:
- Response bias
- Sample size
- Survey design (e.g. leading questions)
- Missing data
- i.e. the information that we fail to record (more to come in Session 3!)
Any mode of data collection is imperfect; it is an attempt to record phenomena in our world. Being aware of these imperfections is the key!