# Attribute data
# Types of attribute data
- Review: Attribute data tell us “what” is happening.
- This kind of data describes things like household income, air quality, or unemployment rates.
- For attribute data to be legible to computers, we have to store it in highly structured forms that computers can understand. We can call this "machine readability."
- The two most basic of these forms are strings and numbers
- Strings are combinations of letters: humans can read strings as words or codes
- The word
high, the nameBack Bay, and the codeBOS0001are all examples of strings.
- The word
- Numbers record countable observations and values.
- Numbers, in turn, might have different forms, like counts, fractions, or percentages
- For the most part, a computer can only understand "plain" numbers: integers and decimals. A percentage sign would trick a computer into thinking that it's looking at a string, so it's better to use
0.56rather than56%
- Strings are combinations of letters: humans can read strings as words or codes
# "Seeing" a map's attributes
- Take a look at this map of unemployment rates
- Here, the data is visualized as shades of blue
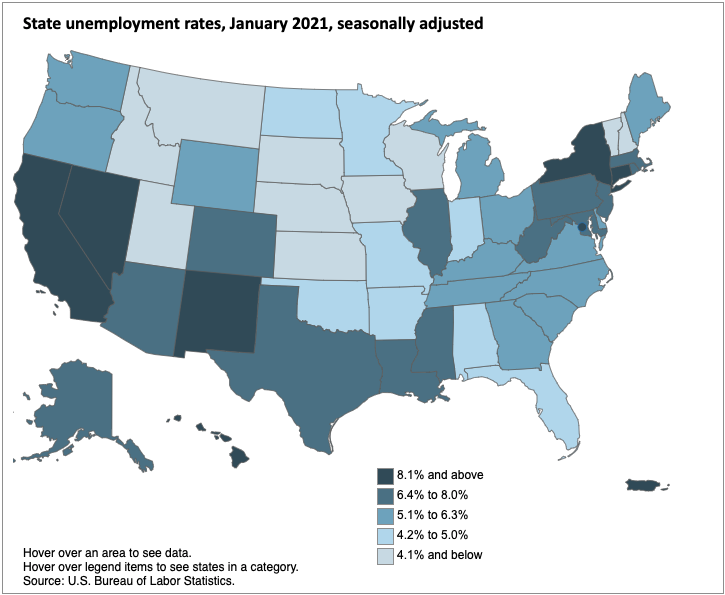
Local Area Unemployment Statistics Map, U.S. Bureau of Labor Statistics(January 2021).
#
- But what does the computer actually "see"?
- Here is the attribute table that created this map presented in spreadsheet form:
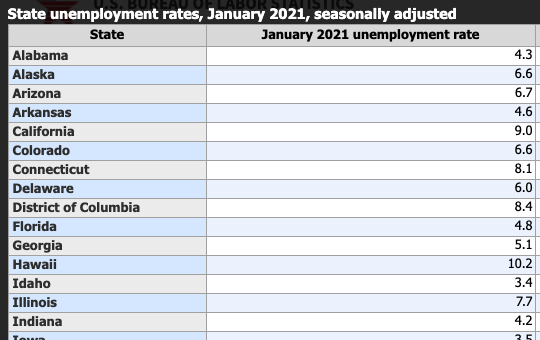
Attribute table associated with the unemployment map. Bureau of Labor Statistics (2021).
Check yourself
In this attribute table, what kind of data is in the State column?
In this attribute table, what kind of data is in the January 2021 column?