# Feature data
# Types of feature data
- Review: Feature data describe “where” something is happening.
- Feature data refers to the actual geography on the earth's surface
- Some features are possible to see in real life, like the trace of a roadway or river
- Some features are invisible, like the boundaries of a state or a census tract
- We also call it the geometry or the shape
- There are two types of feature data: raster and vector
Raster data is like a giant piece of gridded paper, where each cell is a section of the Earth's surface
Vector data is like a game of connect the dots, where dots can be connected as points, lines, or polygons
Remember, a computer is not very smart when it comes to shapes!
- It doesn't know what "a circle" is, and certainly not what "the shape of Massachusetts" is
- Raster and vector data are both methods for creating shapes out of simple numbers and rules
TIP
Raster data is like mosaics: tiles of equal size that when arranged and colored in, make a picture. Vector data is like stained-glass: shapes are pre-cut and glued together to create an image.
# Raster data: the earth as a spreadsheet
- In this map, a grid is laid on top of the northeastern US, and each cell has an attribute (in this case, NO2 emissions, visualized as colors)
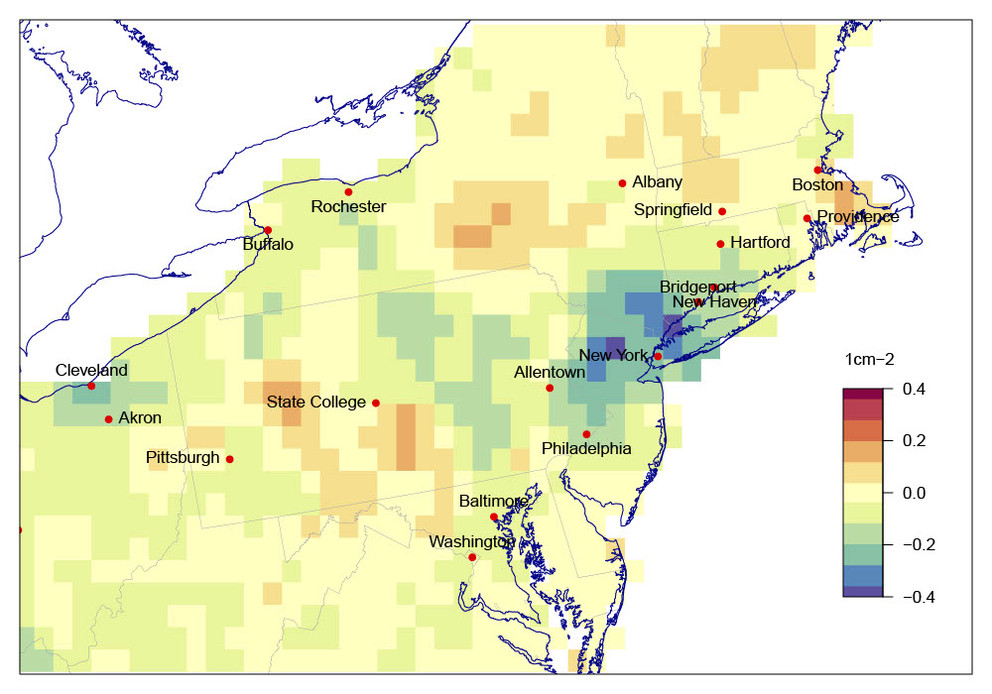
A map showing air quality using raster data—a grid of equally sized squares. Source: Penn State Institute for Computational and Data Sciences
# Vector data: connecting dots into shapes
- In this map, the boundaries of states and the counties inside them are vector geometries
- Each shape is made from dozens of points connected together in order
- Because the points form a closed loop in these examples, they are polygons
- The location of Boston is also vector data; it's a point because it's one-dimensional
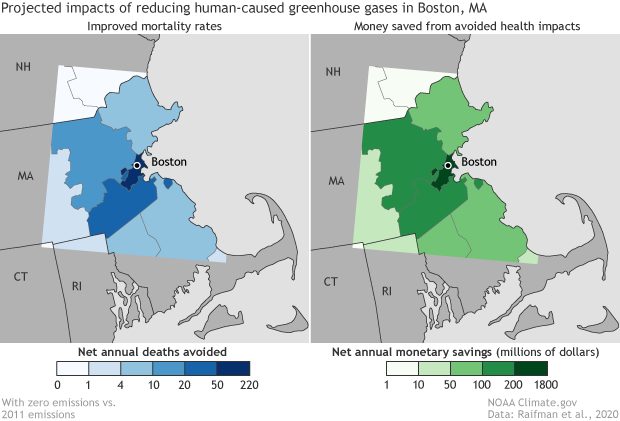
Map showing improved health metrics around Boston, using vector geometry Source: NOAA Climate.gov
# Comprehension check: identify types of data
# Map 1: Health Crisis
- Can you identify which types of geospatial data are used in this map of hazardous sites and poverty in Massachusetts?
- Be specific: identify each element you see on the map and define what type of geometry it is (raster or vector, and, if it's vector, point, line, or polygon)
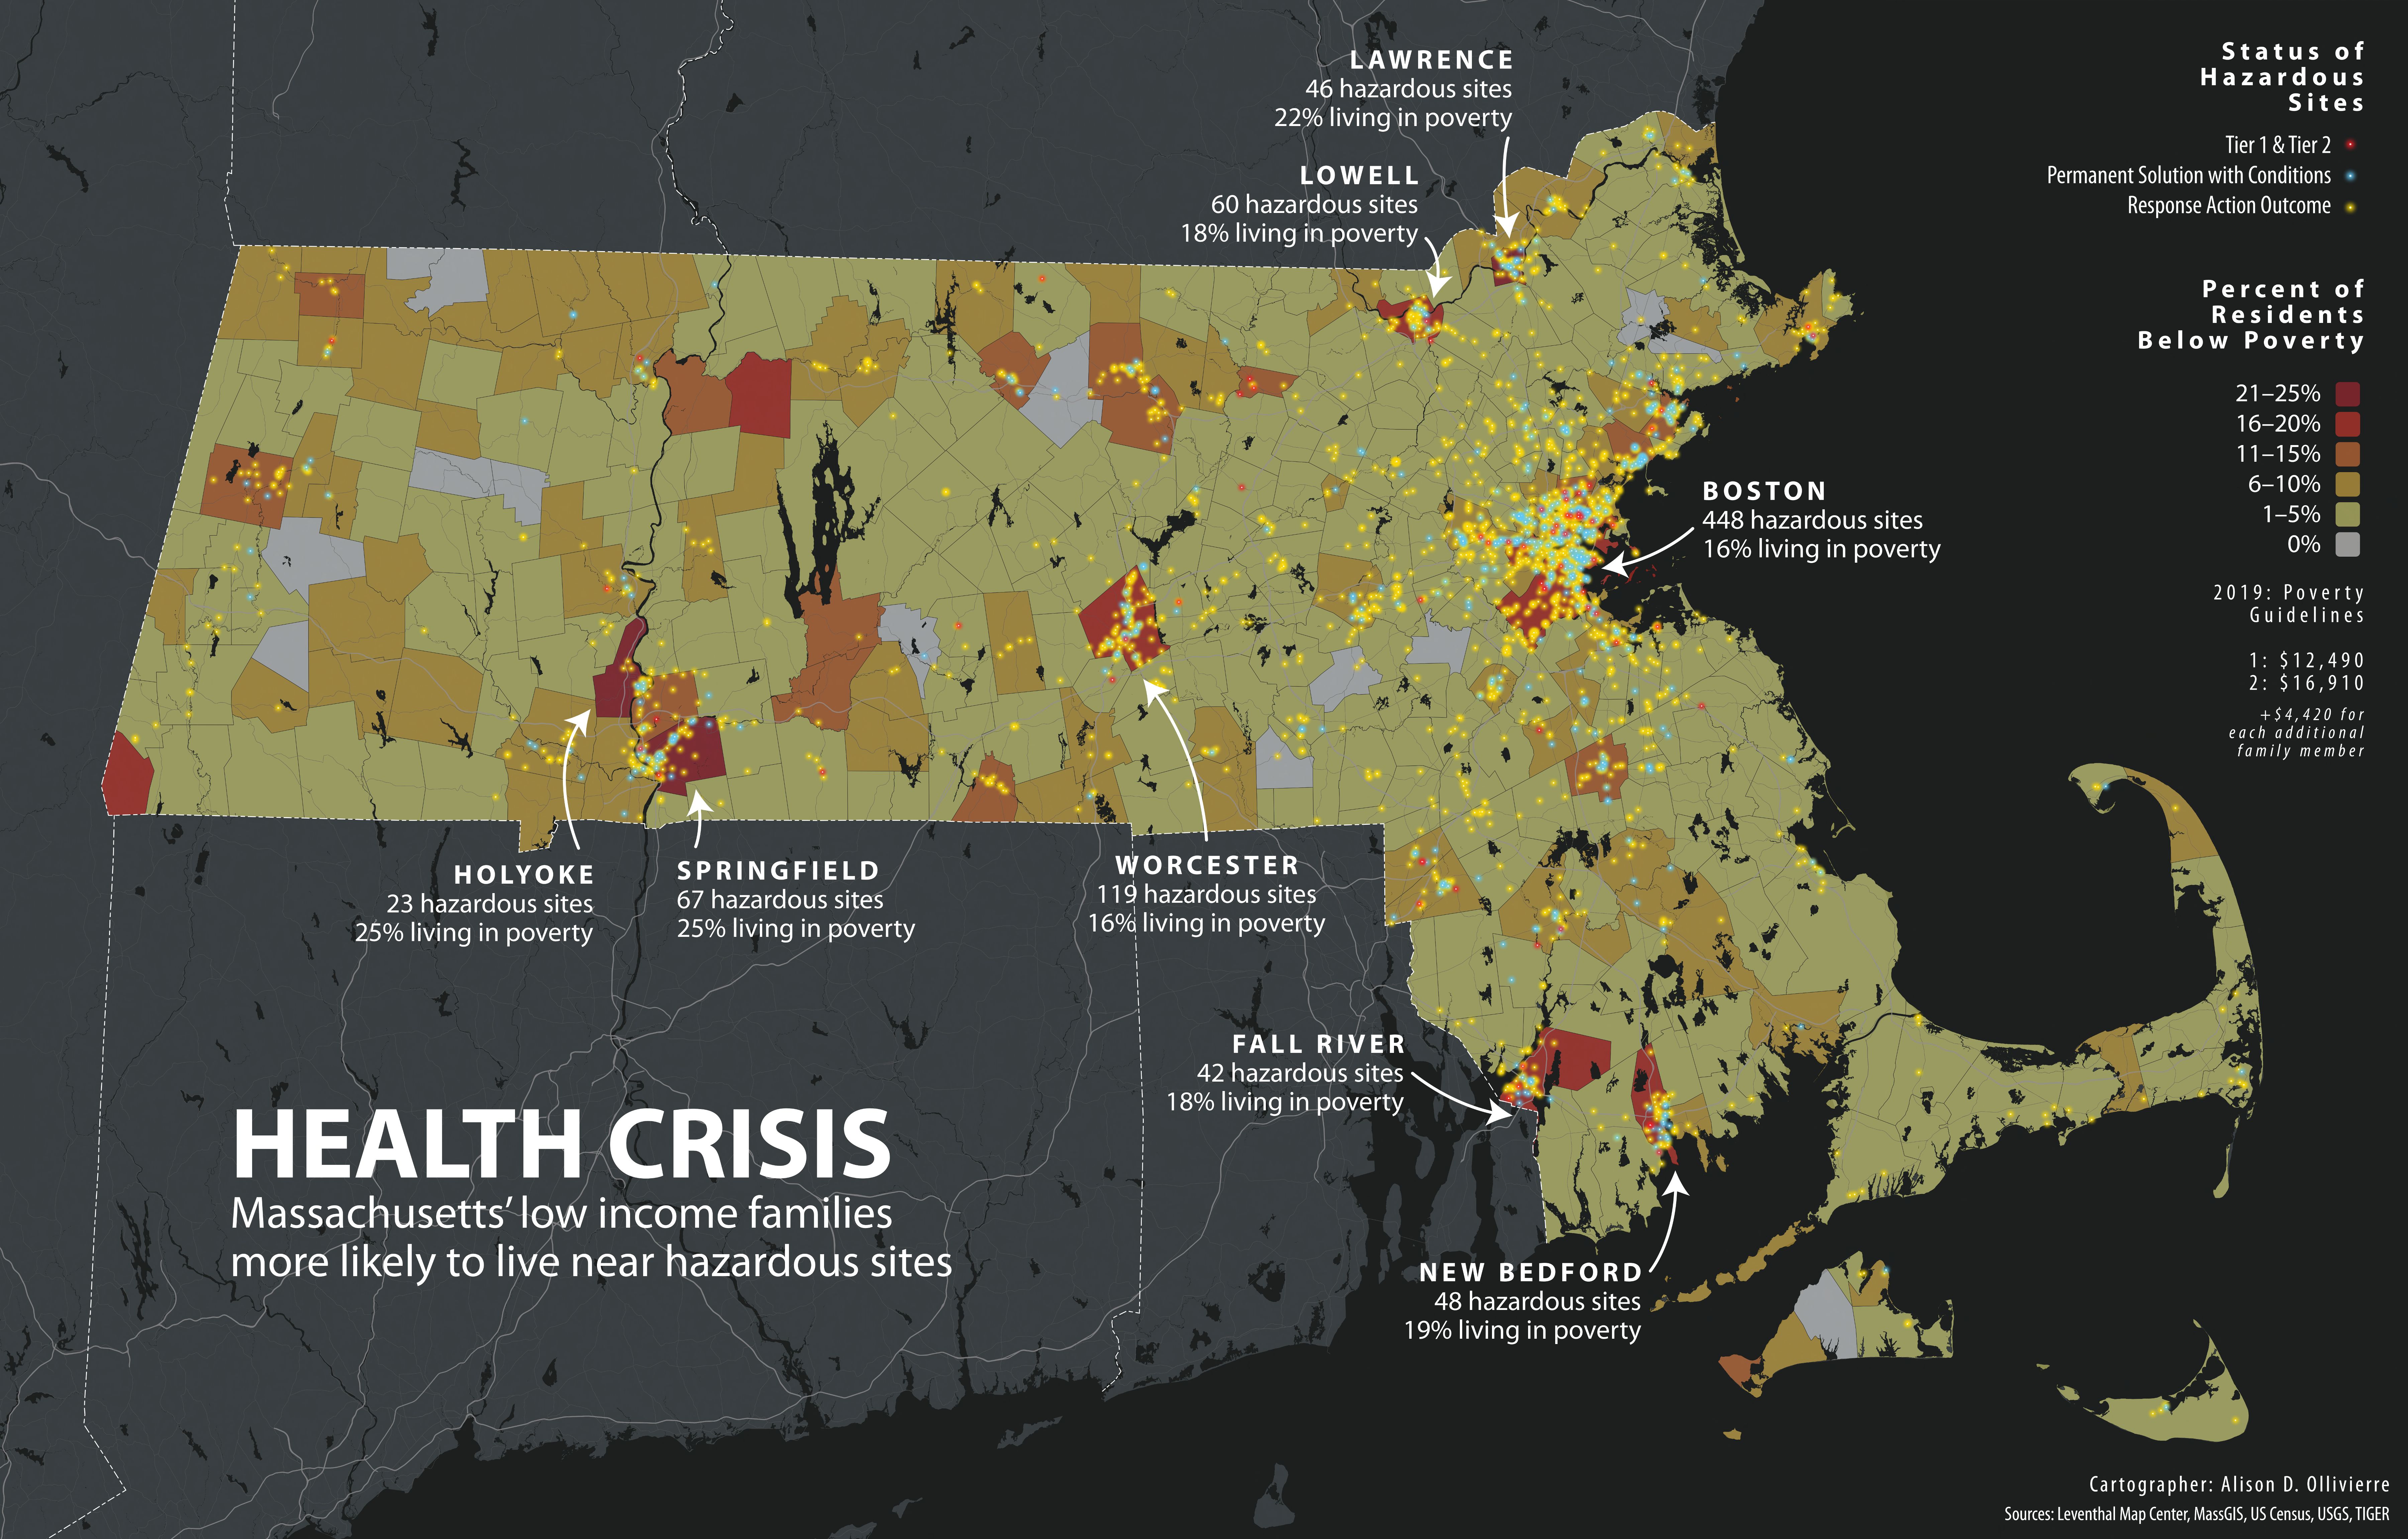
Source: Norman B. Leventhal Map & Education Center at the Boston Public Library
Check your responses for 'Health Crisis'
# Map 2: Boston Open Space and Supermarkets
- What type of vector data are used to represent the supermarkets in this map of Boston?
- What about the parks?
- What about the neighborhoods?
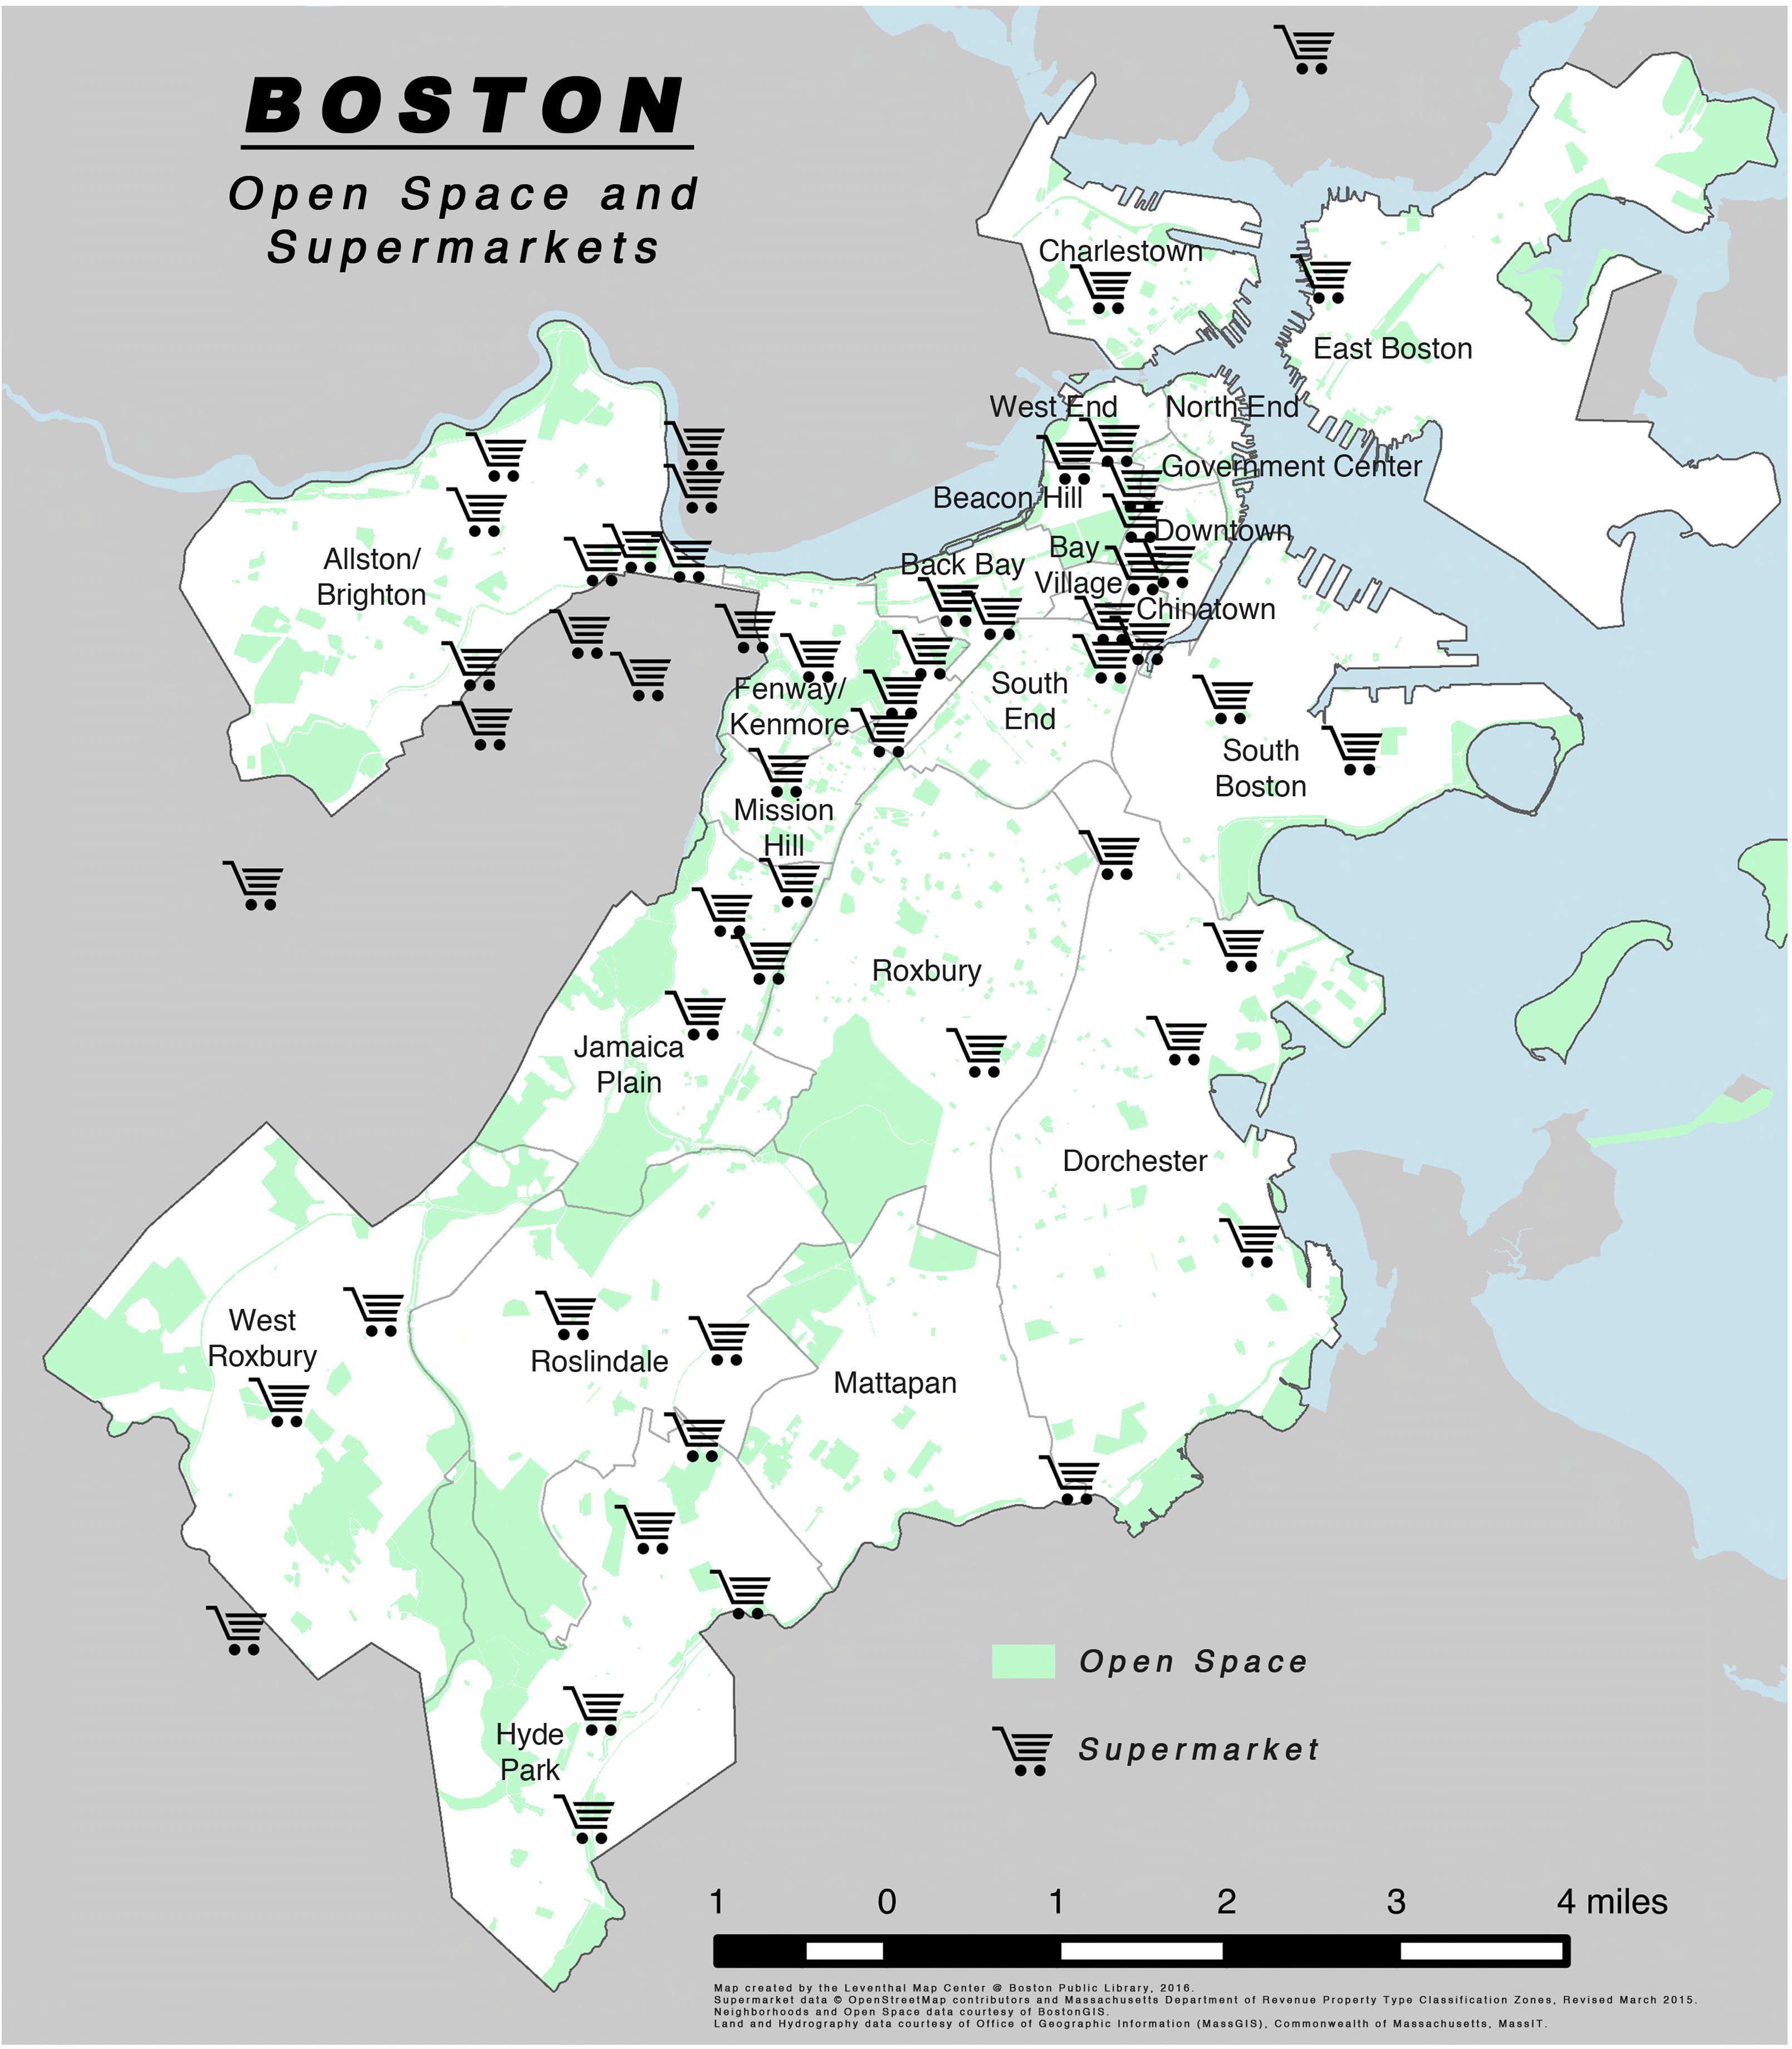
A map showing Boston's supermarket locations and open spaces in the city, Norman B. Leventhal Map & Education Center at the Boston Public Library (2016).