# The human role in mapping: From data to maps
# In between data and maps are people
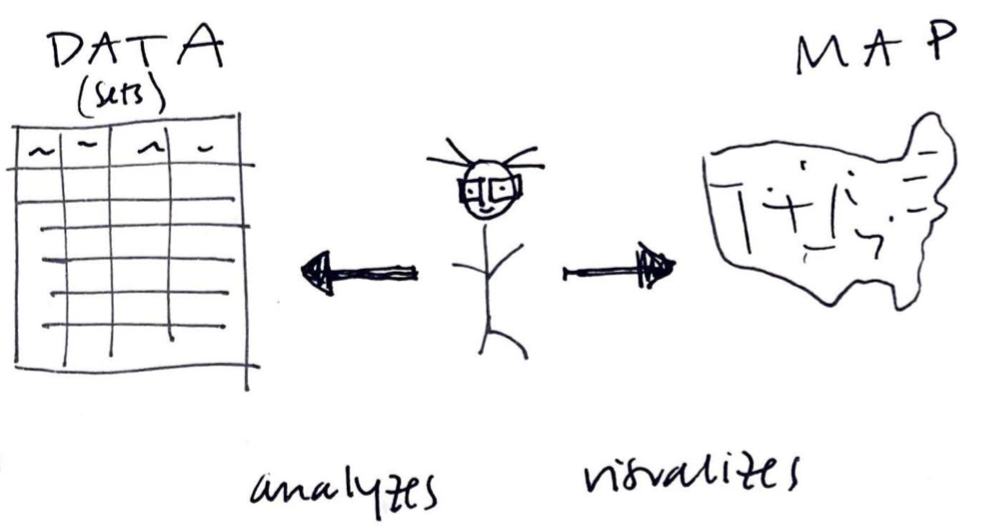
An illustration of the human role in data analysis, Tess McCann (2021).
- Data can never become a map all by itself.
- Any given dataset could produce many different maps.
- Cartographers have power over how we see data.
- It's important to look at the data behind the map; how did the cartographer analyze and (mis)represent the data?
- What kind of arguments do each of these maps make? What do you, as the mapreader, take away from each map?
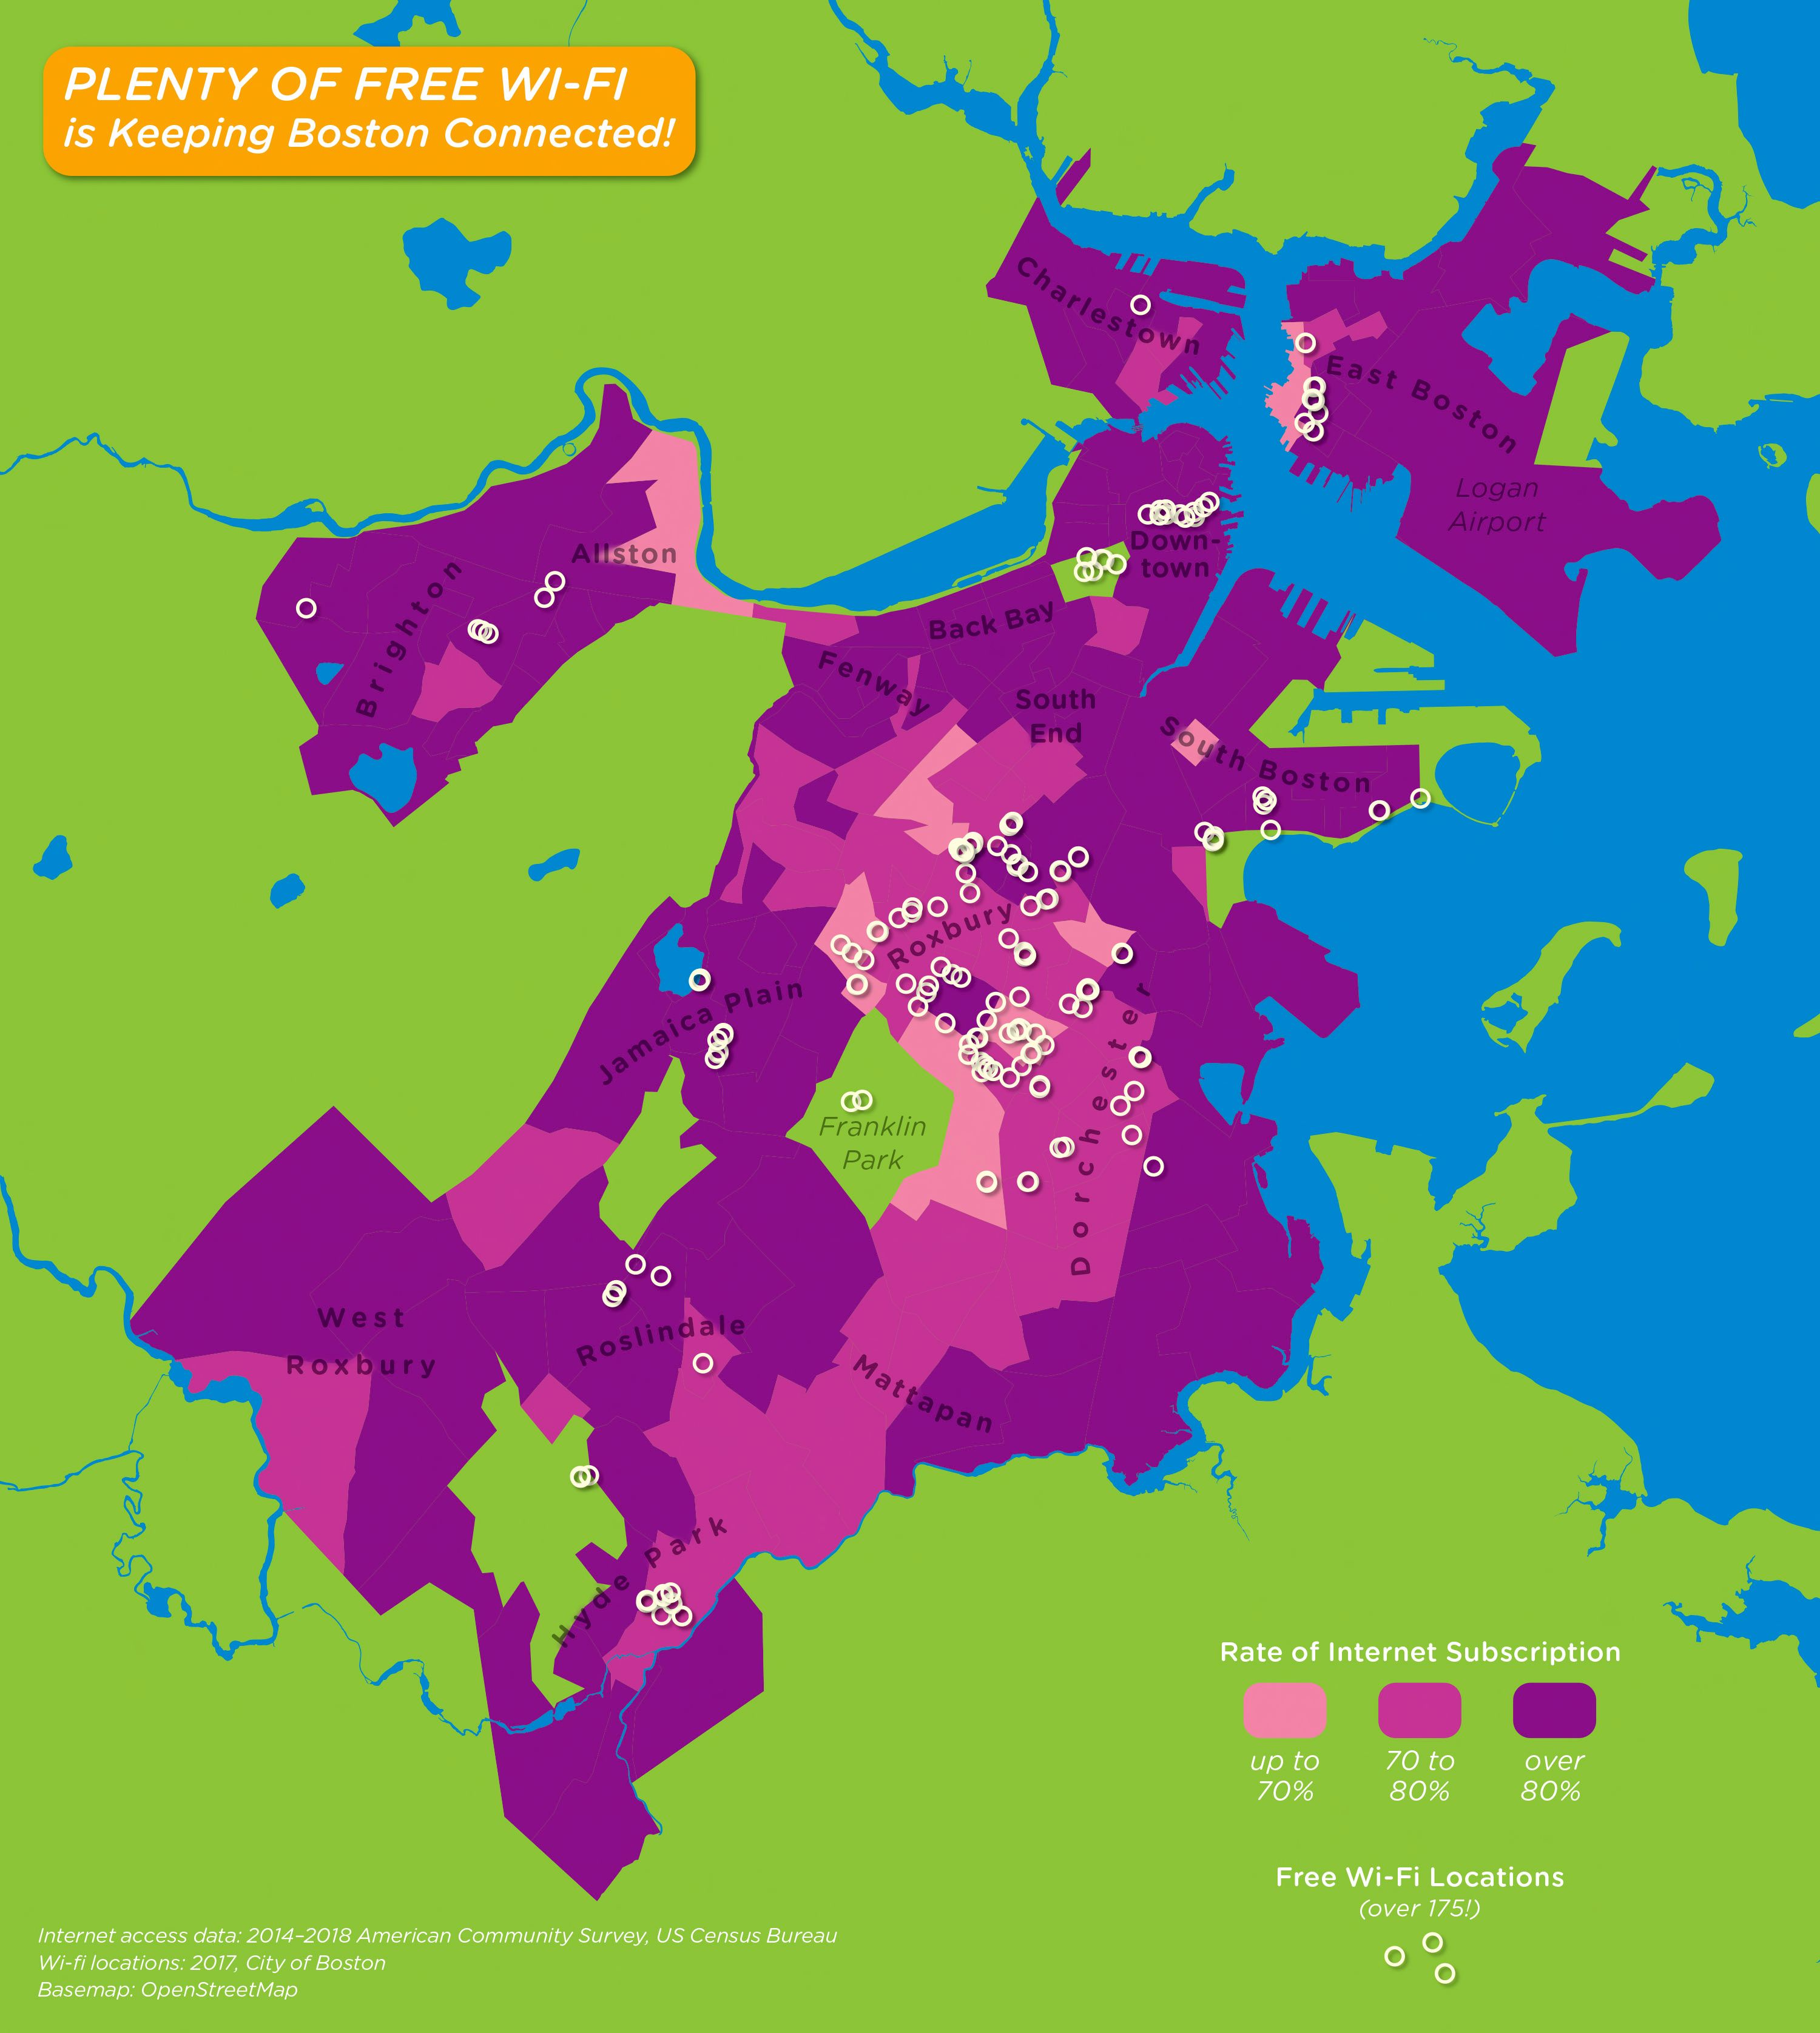
"Plenty of free wi-fi is keeping Boston connected!" by Daniel Huffman, Leventhal Map and Education Center (2020).
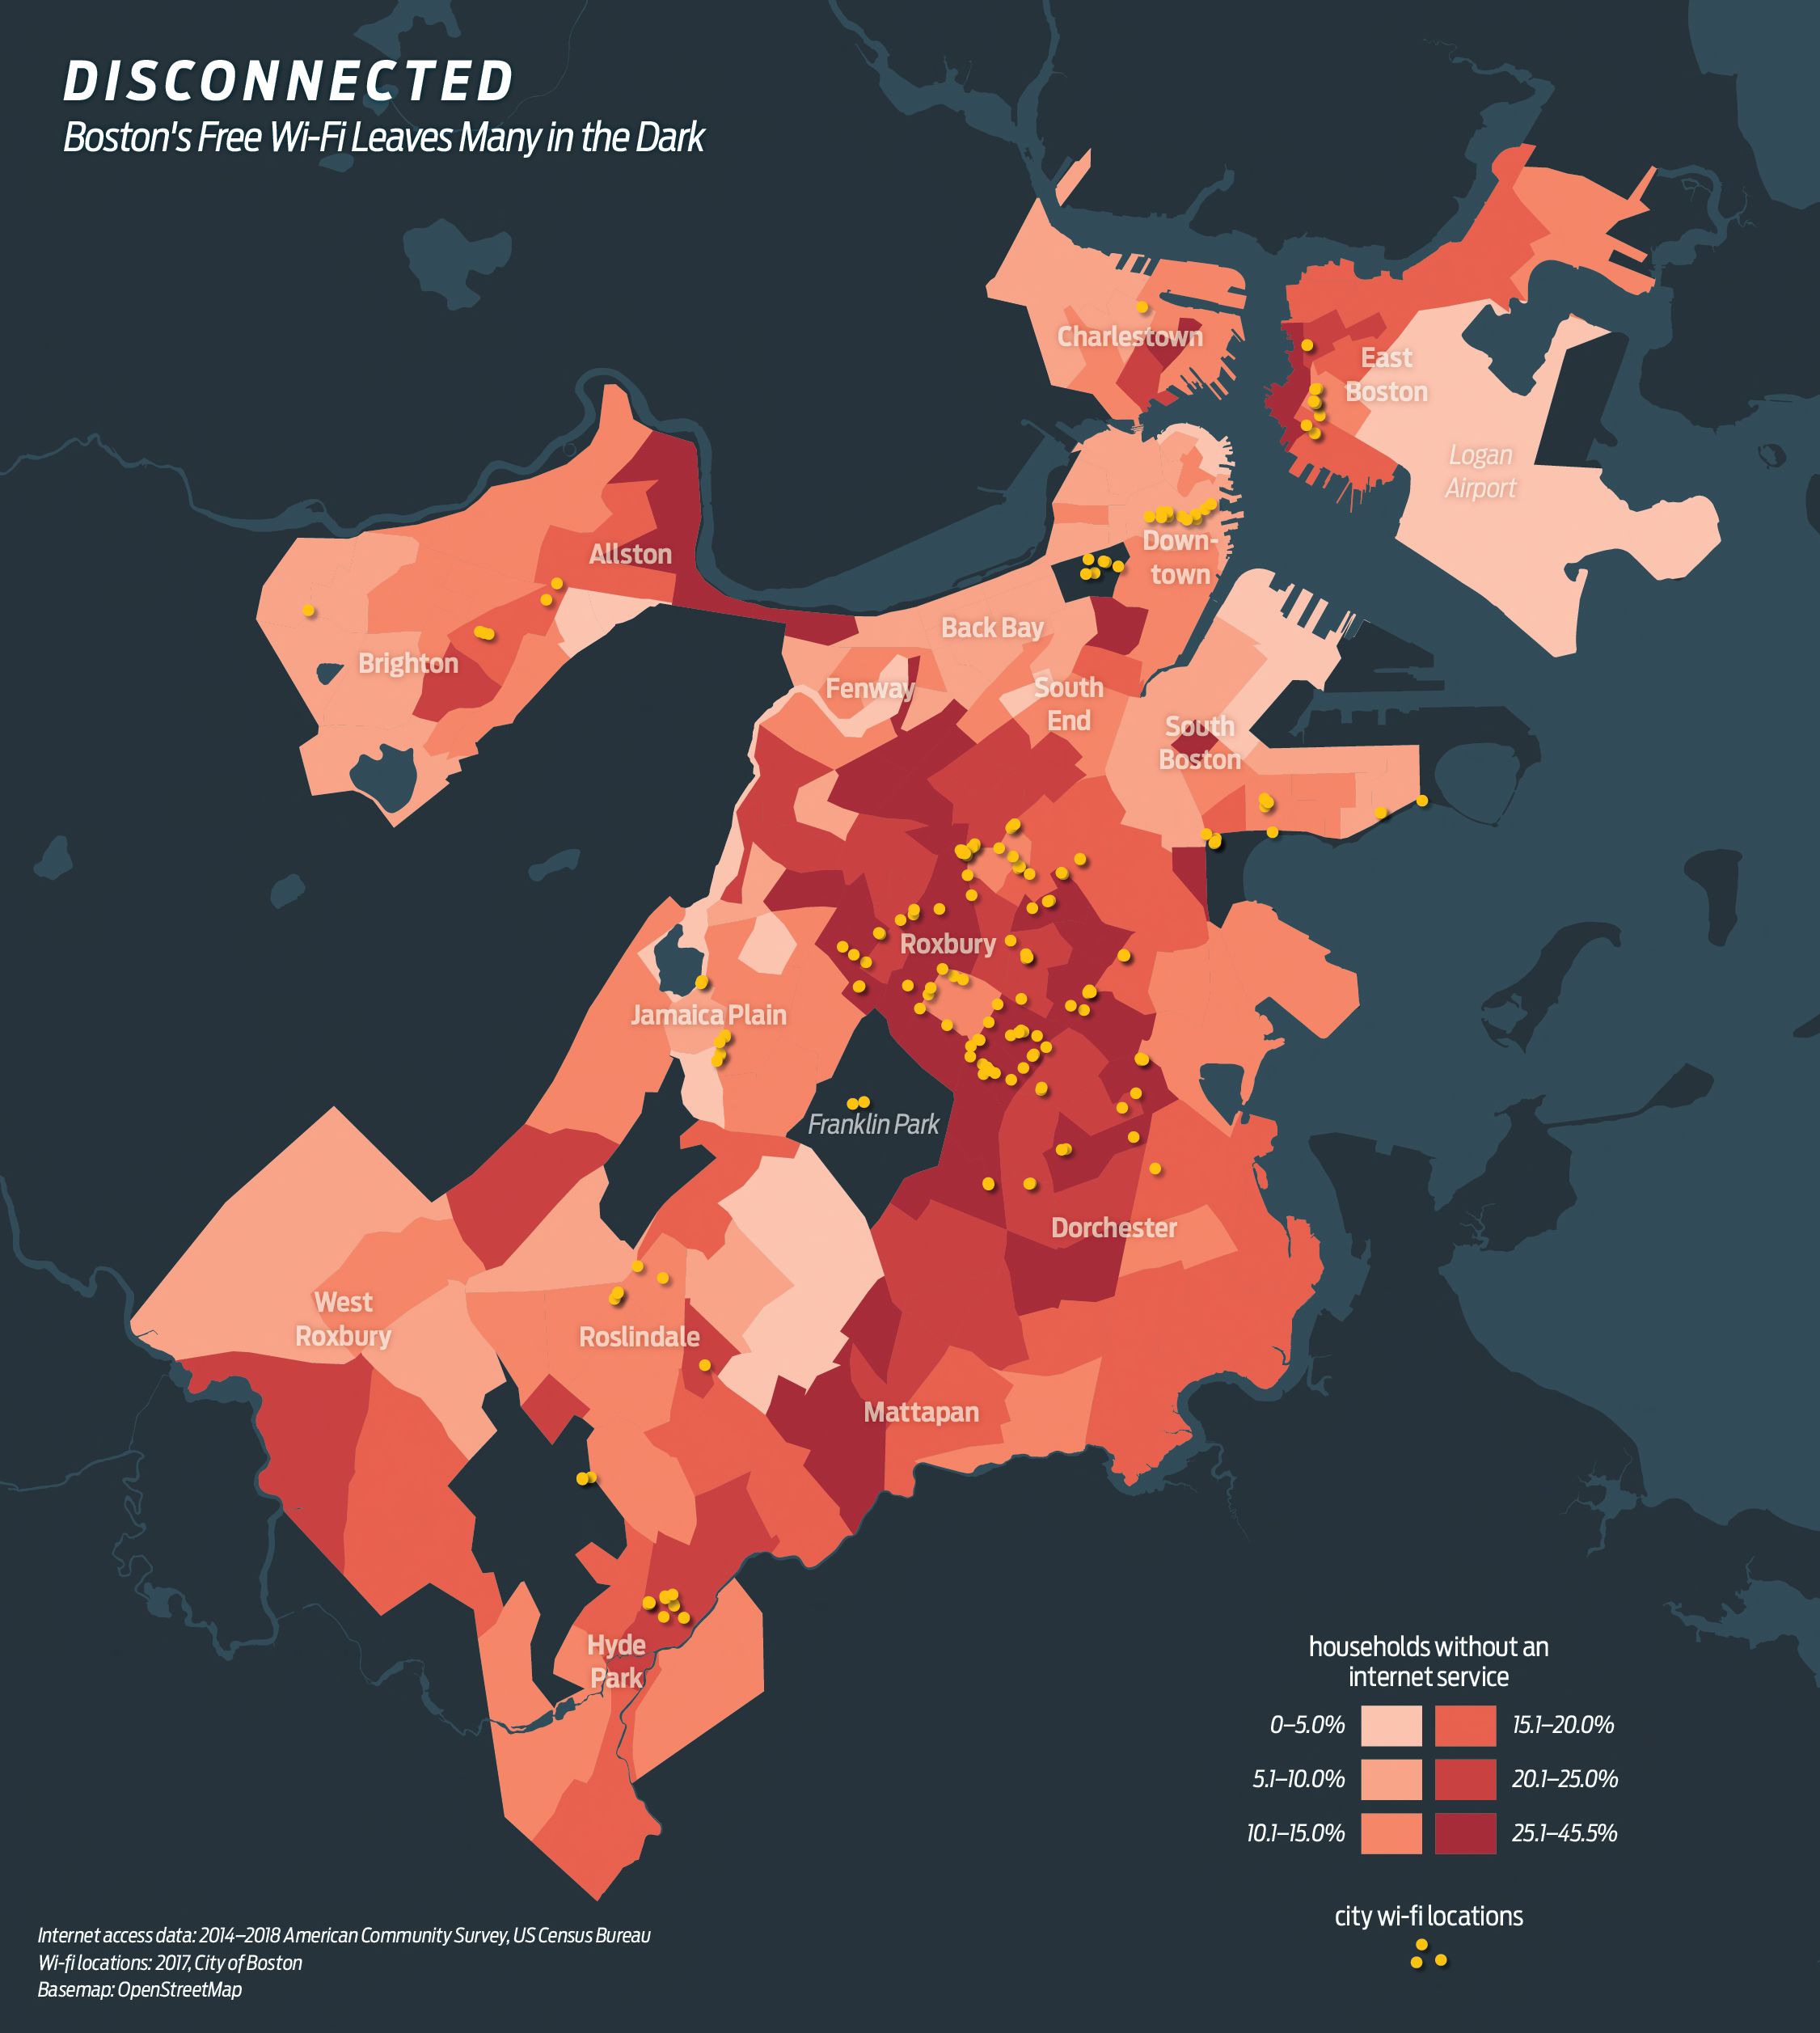
"Disconnected : Boston's free wi-fi leaves many in the dark" by Daniel Huffman,Leventhal Map and Education Center (2020).
More reading on a cartographer's choices
# Discussion: Same data, different maps
Discussion question 1
Consider this Bureau of Labor Statistics map that we saw earlier. What kinds of choices are at play here? What patterns do you notice?
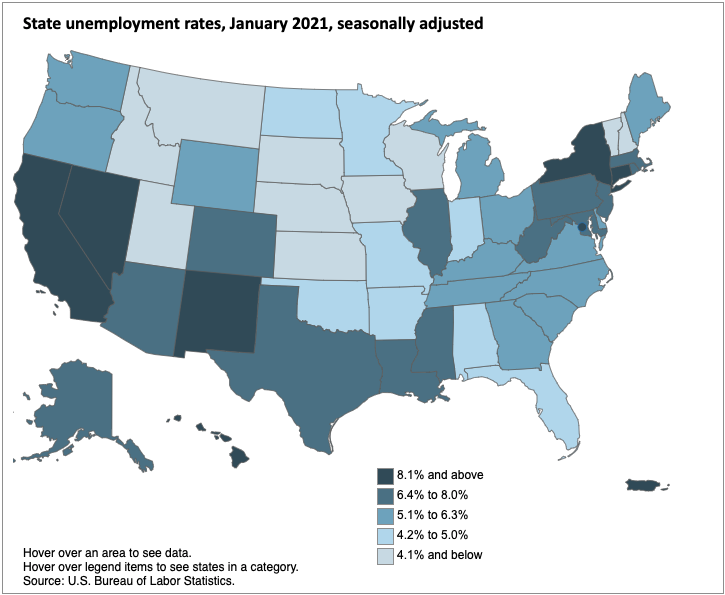
Local Area Unemployment Statistics Map, U.S. Bureau of Labor Statistics (January 2021).
Hints
Discussion question 2
Compare these two maps of sleep deprivation in the United States. Both of these maps were made using the same data source, but they represent the data very differently. Discuss the cartographic choices that influenced the appearance of these maps. Which of these choices do you think were made consciously and subconcsiouly?
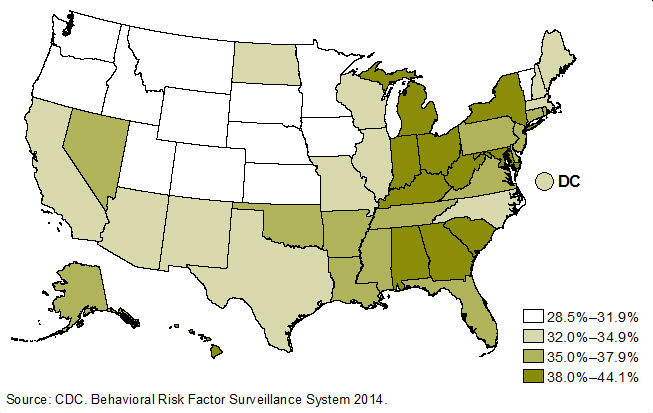
Map of U.S. sleep deprivation, CDC (2014).
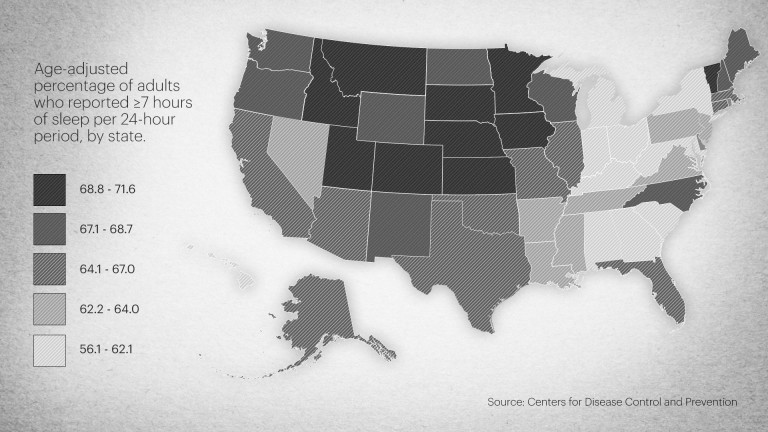
Map of U.S. sleep deprivation, STAT (2016).