# Geospatial data: The what and the where
- Data records observations of phenomena. Data does not exist without human observation, classification, organization, and maintenance.
- Many types of observations can be organized into datasets and visualized, but only spatial data can be visualized on a map.
- Some data is better displayed using non-map figures like bar charts or tables.
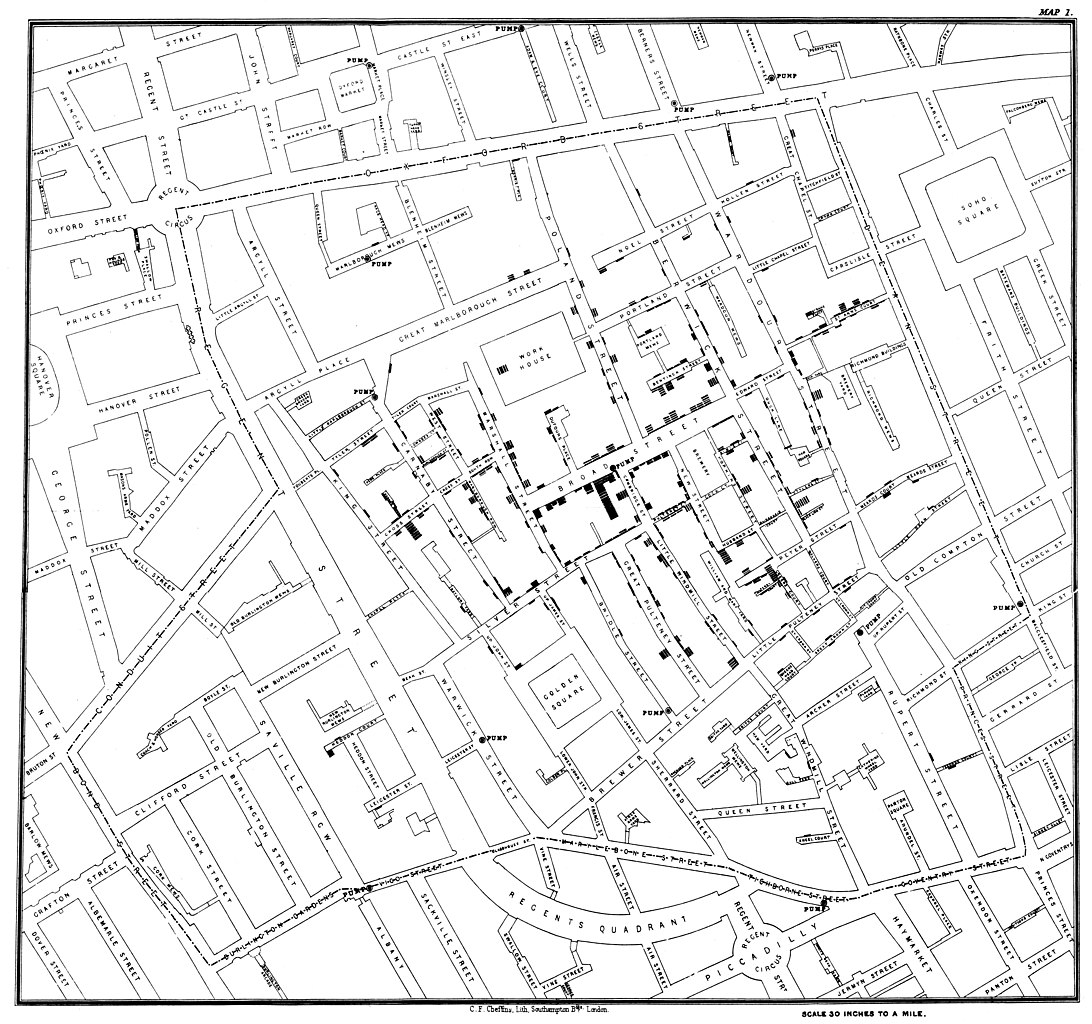
John Snow's map of the cholera outbreak around the Broad Street pump, Artoria2e5, Wikipedia, Wiki./media Commons (1854).
- Geospatial data records what occurs in a certain place. Geospatial data is inherently locational, and, when analyzed, can shed light on patterns across space.
- There are two elements of geospatial data: feature data (which encode information about where an observation occurs) and attribute data (which encode information about what occurs).
- An easy rule of thumb:
- Feature data includes things like state or national boundaries, cities, roads, rivers, and building - things that are physically and observably in the world.
- Attribute data describes an object’s characteristics, like the name, depth, and water quality of a river, the height, construction date, and use of a building, and household income - things you can't see with your naked eye.
More on data: observation, visualization, and discerning patterns
Check your understanding
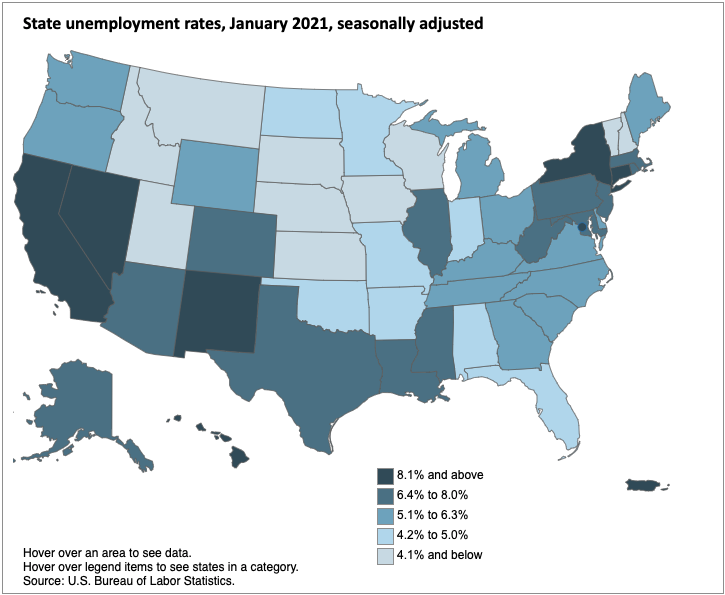
Local Area Unemployment Statistics Map, U.S. Bureau of Labor Statistics (January 2021).
What are the features of this map?
What are the attributes of this map?