# Putting it all together: Messy data exploration
- For a real-life example of dealing with messy data, we're going to use a very important contemporary data set: COVID-19 reporting in Massachusetts.
# Finding the data in context
- This website is where the State of Massachusetts makes its public Covid-19 datasets available.
- Spend some time looking at this site to see what kind of contextual data is available. Who is generating this data? How do we know that it is accurate?
- If we wanted to make a map of COVID cases by town, we'd want to access the "Raw Data." Here's what that link looks like:
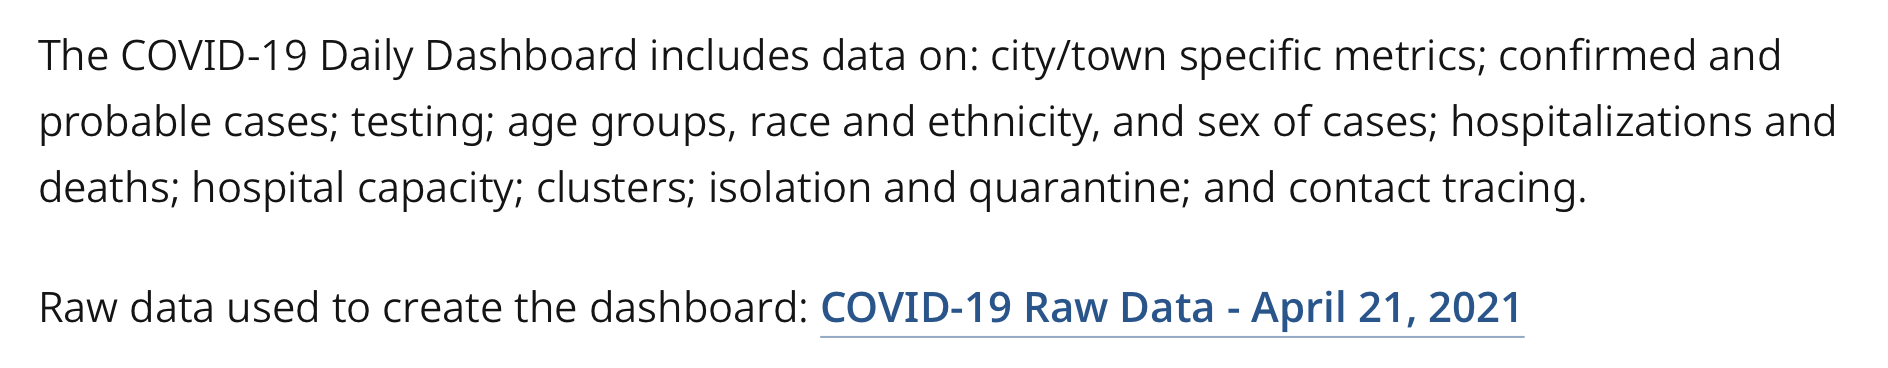
Screenshot of COVID Raw Data link, Massachusetts Department of Public Health (2021).
- But if you click that link, you're not on a map page or a metadata page. You've just downloaded an Excel file to your computer, maybe without even realizing it!
- To simplify this exercise, we've copied this file to our cloud storage so that you can look at it in your browser. See it in Excel Online by clicking here.
# Finding the map diamond in the data rough
- This Excel spreadsheet is a pretty good example of the very messy data sets that you're likely to find "in the wild."
- Spend some time clicking around the file together to see if you can answer the following:
- Which tab helps you understand what is going on in this document?
- Which tab or tabs might be most useful in making a map of Covid-19 cases?
# Putting together what you know
- Once you've made it to the tab
Weekly_City_Town, you'll find yourself with some information that seems like it relates to geography- Massachusetts only has 351 cities and towns, but this workbook has over 20,000 rows! What do you think is going on here?
- What attributes from this data do you think might be useful for making a map?
- Can you see any problems with the data that might confuse mapmaking software?
- What would you need to do in order to relate the
City/Towncolumn to a shape on a map?