# Exercise: Peering into a dataset
# Using metadata to understand what's inside
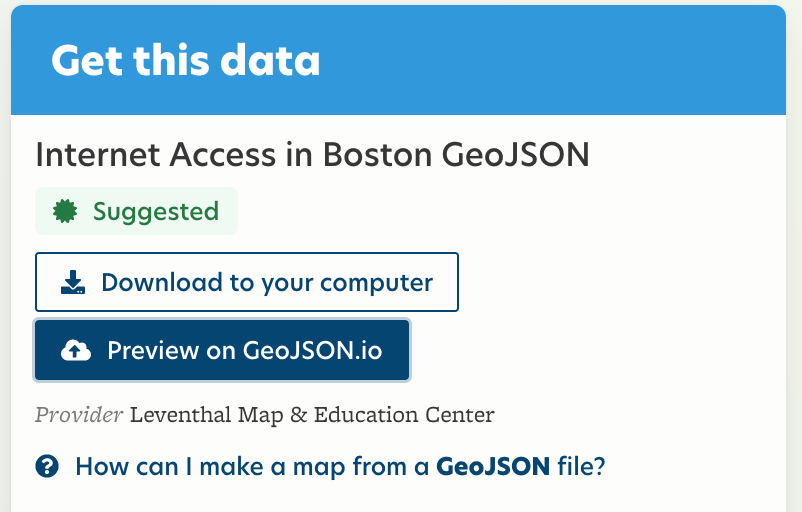
"Preview on GeoJSON.io" button, LMEC (2021).
- From the Internet Access in Boston dataset record, click on Preview on GeoJSON.io, which will open this raw data in the GeoJSON portal we used in Session 2.
- Some key points to note:
- The map on the left shows the spatial features of the dataset. Click on any polygon to learn more about a particular feature. The pop up window shows the attributes and display information for the given polygon.
- The tabs on the right show information about the entire dataset.
- JSON tab: A computer readable version of the dataset - essentially a long list of all the polygons that make up the dataset. Each polygon has its own information including attributes and geometric instructions for how to represent this shape in points.
- Table tab: A more human friendly representation of the attribute data. Each row represents one polygon and each column represents one field. Click on a particular cell to see which feature it points to.
# Understanding attributes
- You'll notice that the GeoJSON file has attributes that might not make sense just by looking at their names. What do you think about the following examples?
TRACTCEALANDNoInternetPctInternt
- Navigate back to the metadata page and see if you can find information that helps you understand what attributes are important and what they mean.
Check yourself
Which attribute in this data set do you think is most likely to be the unique identifier for joining?
What does the metadata tell you about how the PctNoInt attribute was created?