# How to clip data to a desired geography
In this guide, we'll walk through the process of clipping a dataset to a desired extent.
Data is clipped to geographic extent for a variety of reasons. A primary consideration is the size of the data; the larger the amount of data, the more unwieldy and time-consuming processing that data becomes. For this reason, masking out areas unrelated to the project extent can be a useful tool.
You also may want to clip data for purely aesthetic reasons; maybe you're making a map and only want to show specific areas, but the data available to you covers a more comprehensive area.
In this tutorial, we will take a fairly large dataset -- building footprints for the state of Massachusetts -- and clip it to the extent of a Boston neighborhood, Jamaica Plain.
By the end of this tutorial, you will have learned:
- How to download datasets from the web and work with them in QGIS
- How to isolate geographies to create clipping extents
- How to clip data using a clipping extent
# Acquiring data
For this task, two datasets are required:
Massachusetts building footprints to be clipped and
Boston neighborhood boundaries to isolate Jamaica Plain as the clipping geography
1). Navigate to each dataset's webpage in a new tab: buildings | neighborhoods
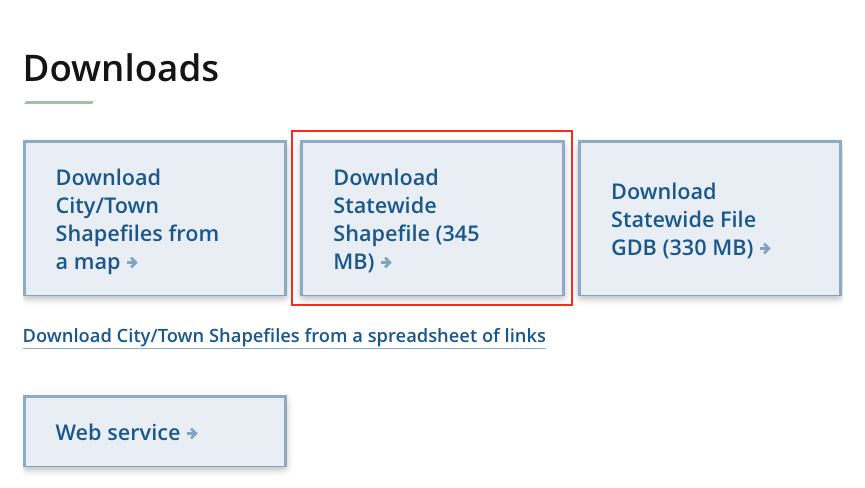
Download the Massachusetts Building Footprints by clicking "Shapefile"
Download the Neighborhood boundaries on the Analyze Boston page by also clicking "Shapefile"
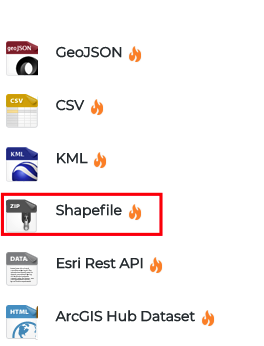
and then selecting "Download"

- Unzip or uncompress both of the zip files, saving them either in your downloads folder or somewhere else you can easily access them.
# Prepare data for clipping
Open QGIS. If you do not already have QGIS, you can learn how to download it from the Get Started with QGIS Guide.
Bring both datasets into the program. You can import data by using the import data menu, or by simply dragging the file with the .shp extension into QGIS.
You will notice that the STRUCTURES_POLY file (buildings) takes a long time to fully load. This is part of the reason we want to clip it. For now, you can uncheck STRUCTURES_POLY in your layer list. We are going to work with the neighborhood file first.
- Uncheck STRUCTURES_POLY in the layer list, temporarily turning off the buildings layer.
Before we are able to clip the building layer, we will need to create a clipping layer to do so.
We want to clip by the geography of Jamaica Plain, so we downloaded a GIS file in which Jamaica Plain exists as one of the features. We will export just that feature to a new layer, and use that new layer to clip the building data.
This process can be repeated with many different clipping geographies. You will have to be clever about the data you download to create your clipping layer. For example, if you want to clip by a town, you can download a shapefile in which the geographic unit is towns. You can use census tracts, counties, states, or even draw your own geographies to clip by.
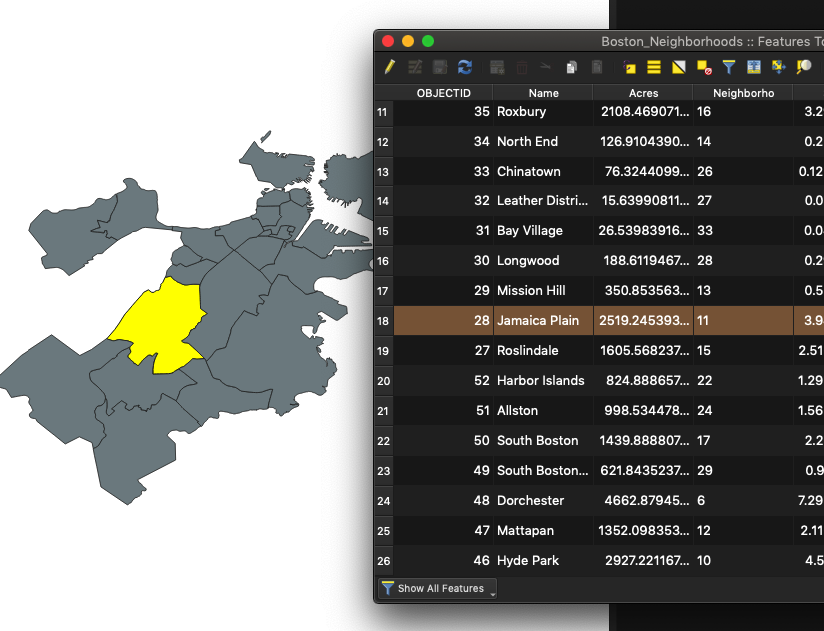
To begin isolating JP, let's observe the neighborhood data's attribute table.
Open the attribute table by right-clicking on the neighborhood layer in the layers list, and selecting "Open Attribute Table"
Highlight the row representing Jamaica Plain by clicking on the number to the far left of the record (in this case, 18). When the record is properly selected, Jamaica Plain will appear to be highlighted in the map:
Close out of the attribute table by clicking the red x at the top of the attribute table window.
To export only selected features and save them to a new dataset, right-click the layer (Boston neighborboods) in the layer list, and select
Export → Save Selected Features As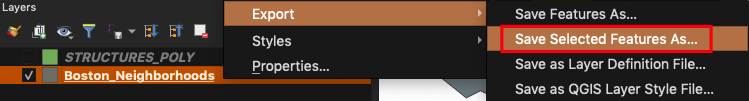
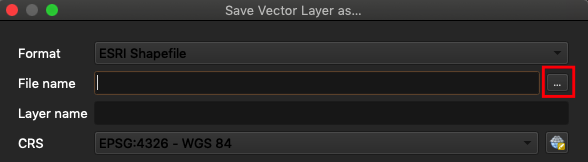
Select the following options
Data type: Shapefile, geoPackage or geoJSON are all acceptable choices for vector data. We are choosing shapefile, just for consistency.
Export location: Use the ... ellipses icon to indicate where you want to save the export. As this clipping feature is temporary (a means to an end), we are keeping in our downloads folder, and not saving it anywhere more meaningful.
Projection: This will be specific to your project. We are sticking with the projection the data arrived in, WGS 84.
Keep "Add saved file to map" CHECKED

Once your new layer appears in the map, you can remove the layer with all of the Boston neighborhoods by right-clicking on it in the layer list, and selecting "Remove Layer"
# Clip data by new extent
Now that we have a geography to clip by, we are ready to clip the building data.
To do a rough clip of one layer's geometry by the geometry of another layer, you can use the tool available from Vector menu → Geoprocessing Tools → Clip.
Rather than clip the input data to the exact extent of the masking layer, we probably should instead extract all features from the building layer present within the extent of the clipping layer. This method will ensure that buildings along the neighborhood border won't be cut in half.
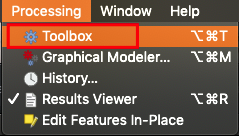
1). Select Processing → Toolbox
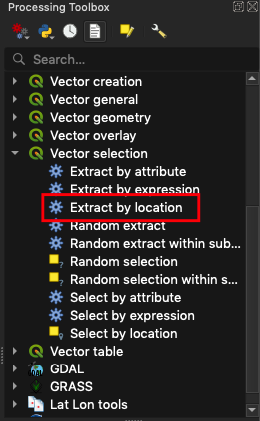
2). Select Vector Selection → Extract by location
3). Select the following settings:
Extract features from: Data you want to clip, in this case, building footprints, or STRUCTURES_POLY
Where the features (geometric predicate): In this case, selectare within. Take a moment to look at the other options. This powerful suite of spatial editing tools extends your ability to wrangle geospatial data into the exact format you are looking for.
By comparing them to features from: newly created clipping geometry layer
Extracted(location):Ellipses → Save to Fileto name the final data output and save somewhere that makes sense. In this case, we will name the output "buildings_jp" The default format is geoPackage (.gpkg), which is OK - it's an open version of .shp
Open output file after running algorithm: Checked ✓
3). Run
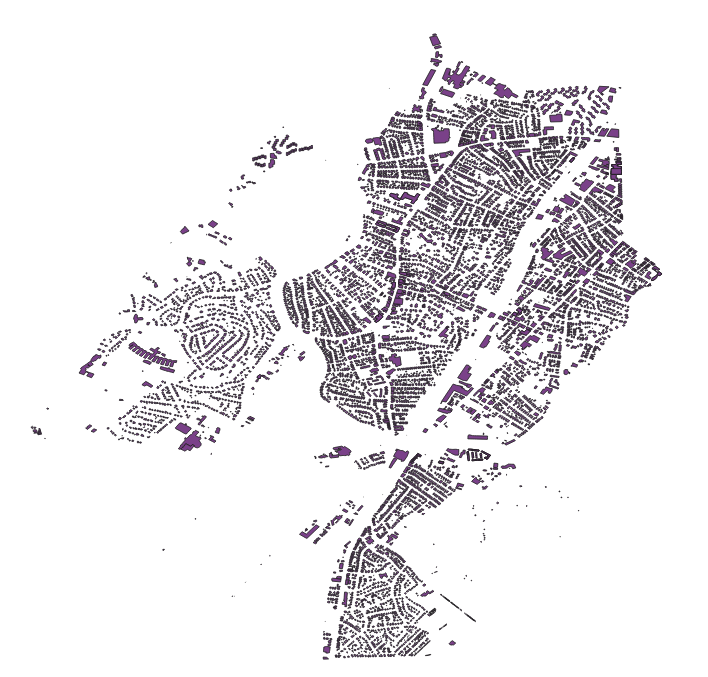
When the tool has finished running, the final, clipped data will be added to the map.
4). Select close on the extract by location window to return to your map, and explore the new data you created to ensure the desired result has been accomplished.
The final version should resemble something like this:
For questions related to geospatial data and mapping, please visit https://www.leventhalmap.org/research/gis/